Incident & Maintenance messages
Using Incidents you can communicate outages and planned maintenance to your audience — customers, co-workers, partners — or whoever might be lucky enough to visit one of your dashboards. This turns your dashboard into a status page!
Note that incidents are nested under dashboards. This means you can have multiple dashboards for different audiences (with different custom domains). Use cases are:
- You run an agency with multiple customers.
- You have multiple internal teams, managing different services in your stack.
- You have a staging and production environment you want to keep tabs on.
Creating incidents
You can quickly create an incident directly from the dashboard’s overview page and publish it to your dashboard in seconds. Things might be on fire. You want to be quick!

Incident types
You can create three types of incidents:
- Major impact: use this for breaking outages that have a major impact. Things are on fire.
- Minor impact: use this to indicate performance degradation, partial failures, etc.
- Maintenance: use this for typical planned maintenance. Nothing on fire, just letting you know.
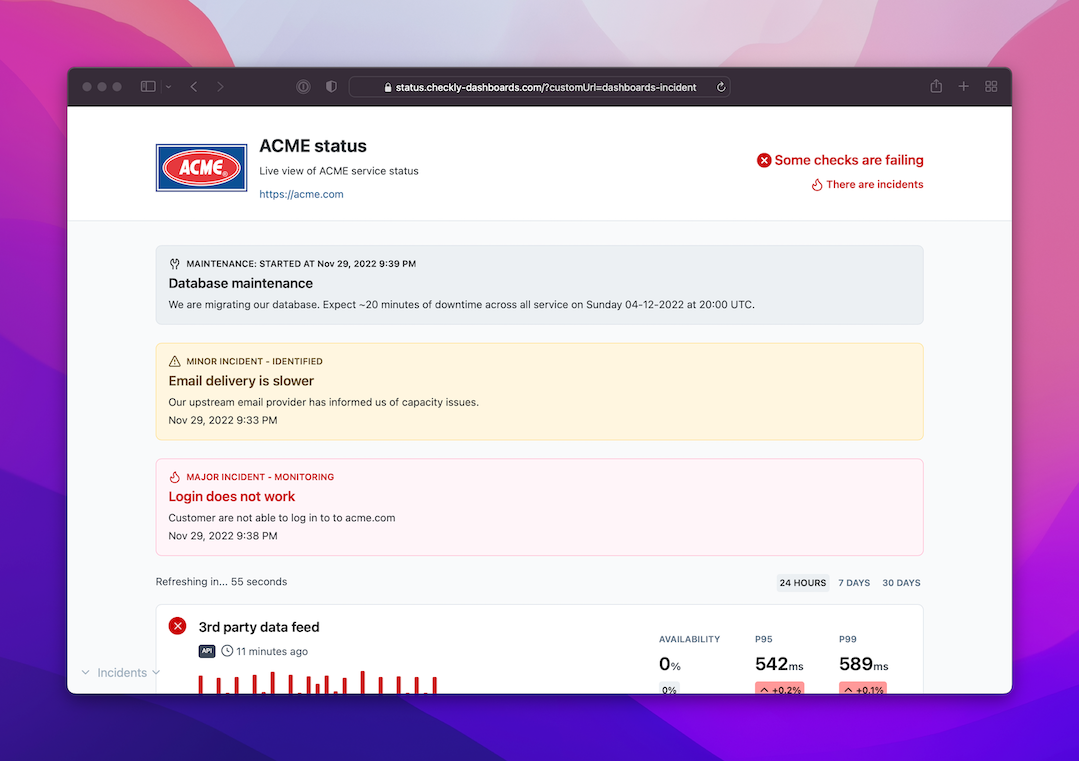
Each type of incident will render differently on your dashboard, indicating a different level of severity. Here is an example:

Incident updates
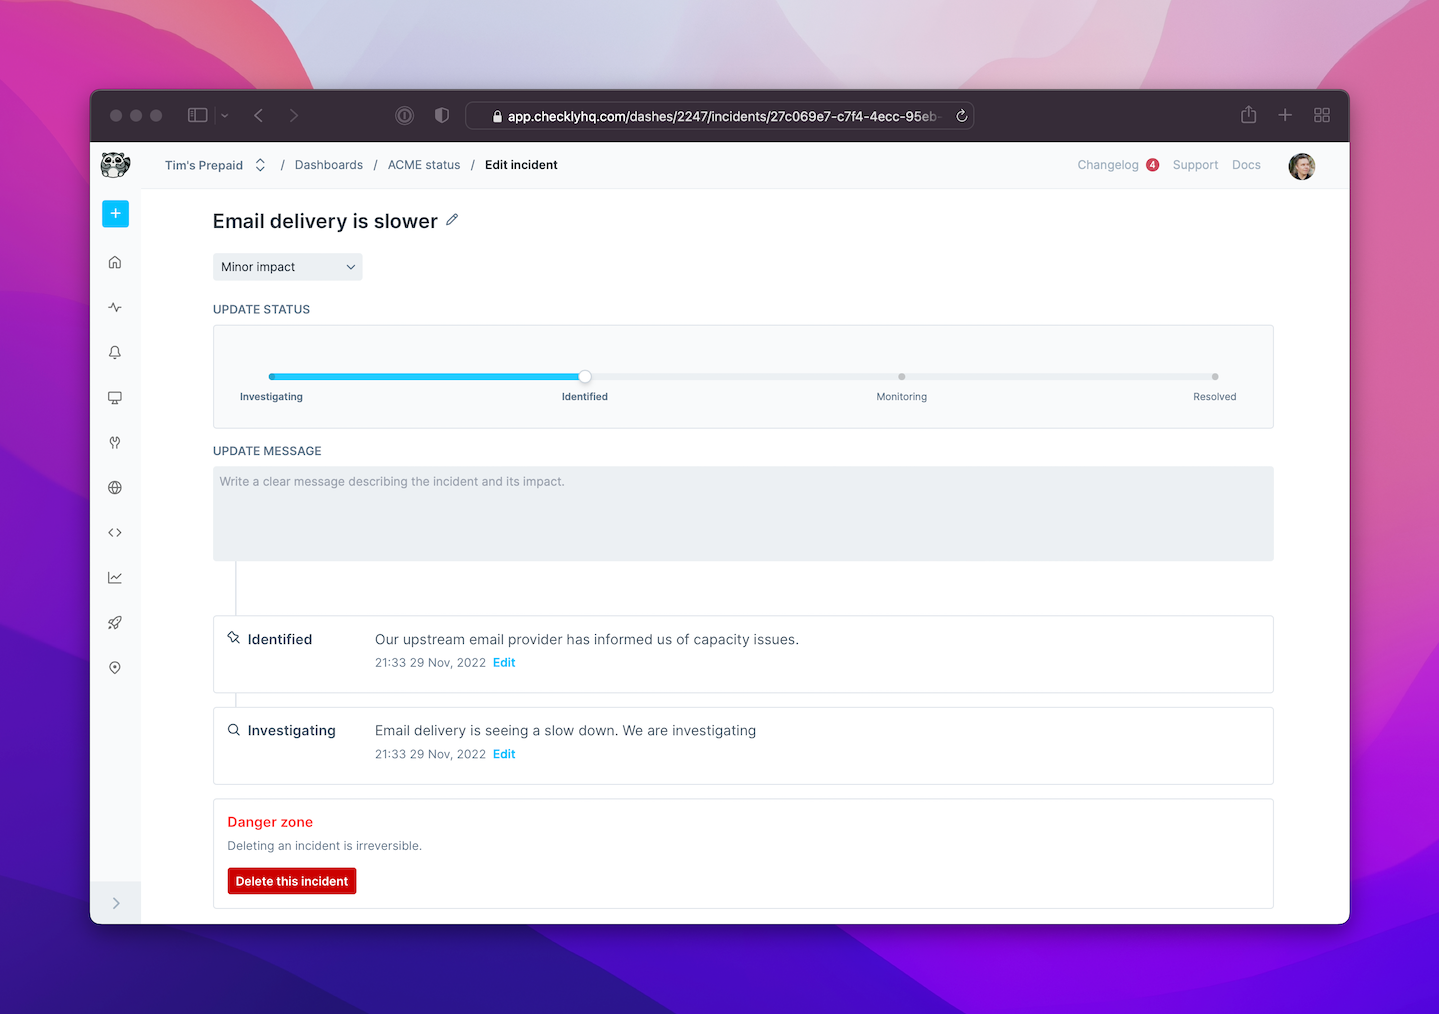
For the major impact and minor impact incidents, you can add updates as you resolve the matter at hand. At each stage you can add an updated message, which will show up on your dashboard to keep your audience in the loop.
It’s very simple:
- Pick the status with the slider: Investigating, Identified, Monitoring and Resolved.
- Add some clarifying text in the Update Message text field.
You can edit any updates later to correct typos. You can also add more updates within the same category of updates, for instance, if the “Investigating” phase is taking longer than expected and you want to post an update.
Here’s an example of what that would look like while typing out the update messages.

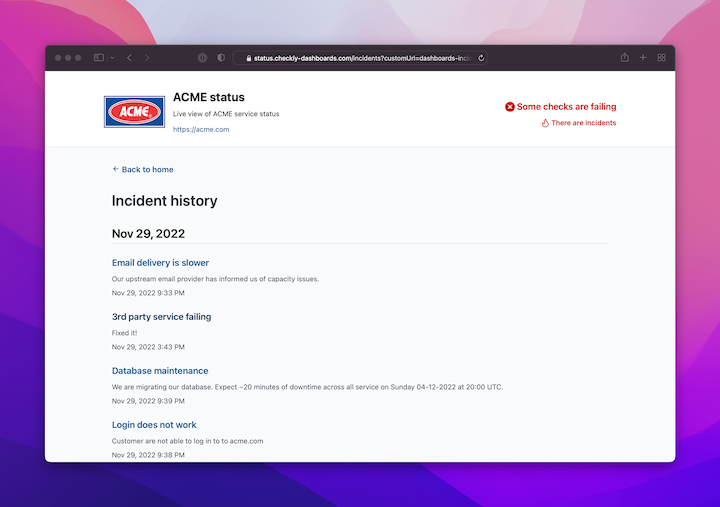
All incidents and their updates will show up on your dashboard (if you have Incidents enabled for the relevant dashboard) in a chronological list for later reference.

Last updated on April 12, 2024. You can contribute to this documentation by editing this page on Github